Efficient Coding
Monitor the GPU Utilization
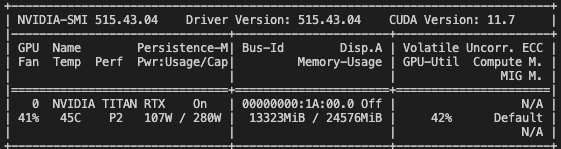
The rule of thumb is to maximize the computation power you have. When working with GPU, that means to maximize the percentage of GPU kernels are running at the same time. This can be monitored by the GPU utilization (last column) reported by the nvidia-smi command:
If the GPU utilization is less than 100%, it means there are some GPU kernels are idling from time to time (if not all the time). This is of course not good for the performance. Under the hood, Pytorch will try to use all the GPU kernels to parellelize the computation, but in most of the case you don’t see 100%. Why is that?
The first reason is simplly that there might not be too much to parellelize, for which we don’t have too much to do other than increasing batch size. For example
# Only 1000 threads are running at the same time to create this tensor.
# So we see 28% GPU utilization.
while True: torch.zeros((1000), device="cuda")
# Now we see 100% GPU utilization.
while True: torch.zeros((10000000), device="cuda")
The second reason, which is more common, is that there is CPU-GPU synchronization happening in the code. For example:
data = torch.rand((10000000), device="cuda")
mask = data > 0.5
ids = torch.where(mask)[0]
assert torch.all(data[mask] == data[ids])

# 100% GPU utilization.
while True: data[ids]
# 95% GPU utilization.
while True: data[mask]
Besides, if there are many cpu operations in the pipeline, such as data loading and preprocessing, it might also cause the GPU utilization to be low. In this case, you can try to use torch.utils.data.DataLoader to overlap the data processing time with the GPU computation time.
Avoid CPU-GPU Synchronization
In the above example, if you time your code, you will see a significant difference:
# 177 µs ± 15.4 ns per loop (mean ± std. dev. of 7 runs, 10,000 loops each)
%timeit data[ids]
# 355 µs ± 466 ns per loop (mean ± std. dev. of 7 runs, 1,000 loops each)
%timeit data[mask]
Explanation: In this case, the mask operation needs to decide the size of the output tensor, which lives on CPU, based on the number of True values in the mask that lives on GPU. So a synchronization is required. The index selection operation, on the other hand, already knows the size of the output tensor based the size of the ids, so no synchronization is required.
You may argue in this case we can’t really improve things because the ids are computed from the mask, which would require the synchronization anyway (torch.where). However, in many cases we can avoid the synchronization by carefully writing the code. For example:
# no sync. 67.3 µs ± 5.01 ns per loop
while True: torch.zeros((10000000), device="cuda")
# sync. 13.7 ms ± 320 µs per loop
while True: torch.zeros((10000000)).to("cuda")
Operations that require synchronization including torch.where, tensor.item(), print(tensor), tensor.to(device), torch.nonzero etc. Just imagine those functions have a inherit torch.cuda.synchronize() called under the hood. See the official guide if with more interests.
In our library, nerfacc.traverse_grids() is a function that requires synchronization,
because it needs to know the size of the output tensor when traversing the grids. As a result,
sampling with nerfacc.OccGridEstimator also requires synchronization. But there is
no walkaround in this case so just be aware of it.
Profiling
There are plenty of tools for profiling. My personal favorite is line_profiler which will give you per-line runtime of a function with a simple decorator @profile. It is very useful for finding where the bottleneck is in your code. It is worth to note that due to the asynchronized nature of Pytorch code, you would need to set CUDA_LAUNCH_BLOCKING=1 when profiling your code (no matter which profiling tool you are using). This variable will force CPU-GPU synchronization for every torch function (equavalent to add torch.cuda.synchronize() everywhere), which can reveal the true runtime of each line of code. And of course, with CUDA_LAUNCH_BLOCKING=1 you would get slower total runtime, so don’t forget to remove it when you are done profiling.